Manual Feature Engineering with 3D Motion Capture Data
First Experiment: Recording of Steps
Task Description
Several straight walks in a row have been recorded using the Xsens MVN system for motion data
and a digital video camera for a visual analysis of single steps. The goal was to produce several annotated
records of a walking human. The focus in this experiment was the step size on a planar ground.
Materials and Methods
As already described the Xsens MVN system was used to record the 3D motion data.
Furthermore a digital video camera was be used to make a video record of the corridor walk.
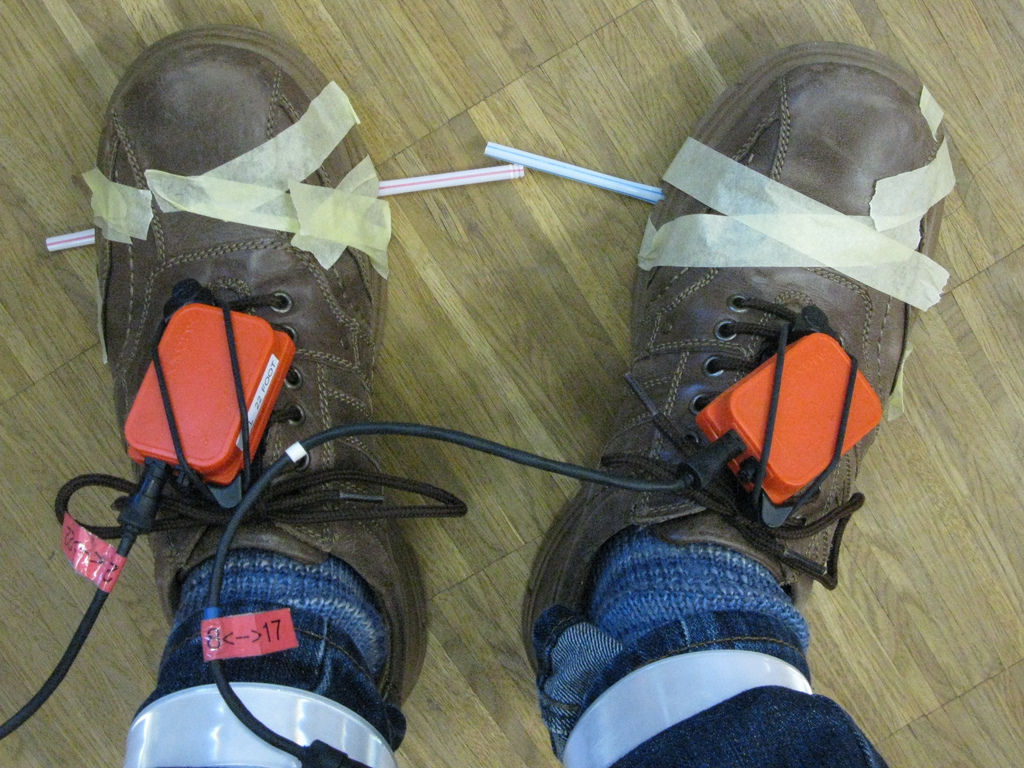
These figures show the setup for the experiment (1);
how straws are used to enhance the accuracy of the reading (2);
and how the person wearing the Xsens MVN system is walking over the setup (3).
For video/image analysis folding rules have been fixed to the floor as measuring leash. Additionally one
straw has been fixed on the walking persons soles. Pointing towards the measuring leash between
the persons legs the straws should make the video analysis of the step size more accurate.
Several approaches to gain video/image data have been tried. First the video camera was fixed on
a flat little cart and slided after the person wearing the Xsens MVN system while it recorded the persons
steps as it is shown in the video of Walk03 below.
Video of Walk03 using a little cart.
As an alternative the person wearing the Xsens MVN system could hold the video camera as shown
in the video of Walk05 further below.
In an other alternative approach images could be taken with a digital camera for every step as shown
in the video of Walk07 further below.
The internal time of the electronic recording systems must be synchronised!
The video data as shown in the video of Walk03 was nearly impossible to read.
Accordingly the video data from Walk05 was still very unsatisfying. The analysis
of the images as presented in Walk06 and Walk07 was better,
but the gear of the person wearing the Xsens MVN system was quite unnatural.
Declarations
Step Number
starting point, both feed side by side.
Side
left or right foot earlier
Time
time of reading
Time [s]
relative time of reading
Position Straw (Front)
Position of straw (front of straw) on the measuring leash
Bar
Bar the straw is pointed on (Bar 1 = first bar after starting point),
2r means the step was measured on the reverse direction on the second bar.
Position relative
The measuring leashes were fixed next to one another with the scale in reverse order:
Bar 1 - 2m…0m, Bar 2 - 2m…0m, The corrected position equals a 4m
measuring leash starting with 0 on the rear foot in the starting position.
Quality of image regarding the accuracy of the measurement point.
Walk05
The step length in this walk was read from a video file generated by the person wearing the Xsens MVN system
as shown in the video below.
Video of Walk05 showing a person taking a video of a walk without cart.
Visualised Movement Data
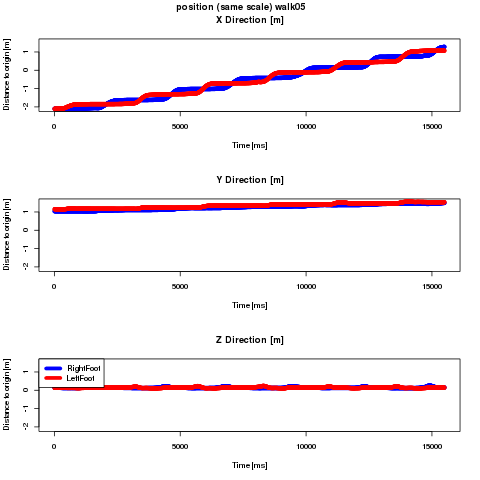
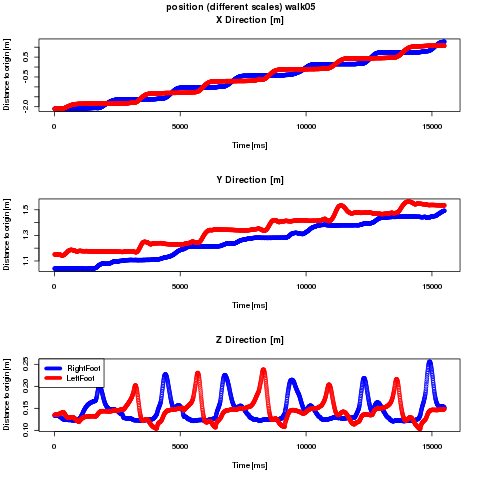
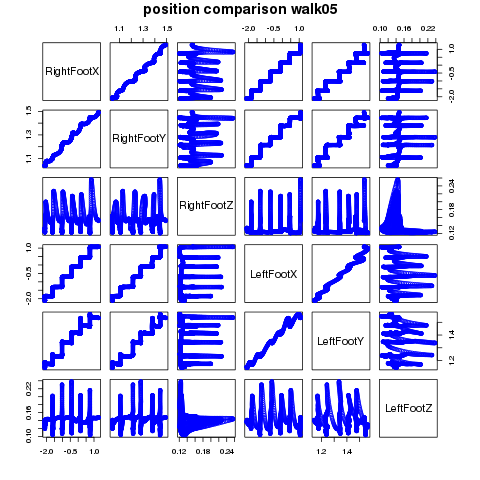
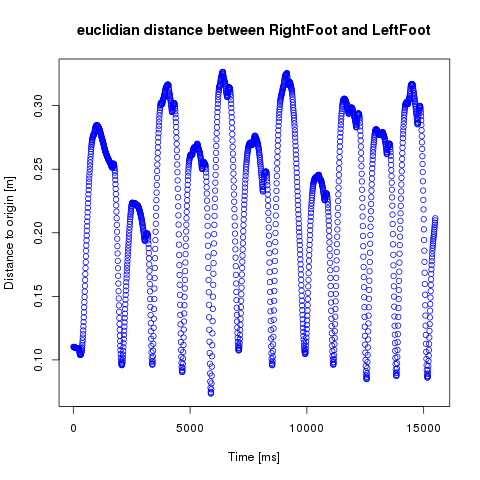
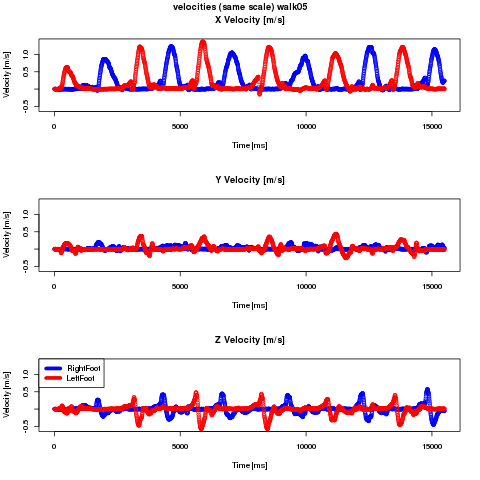
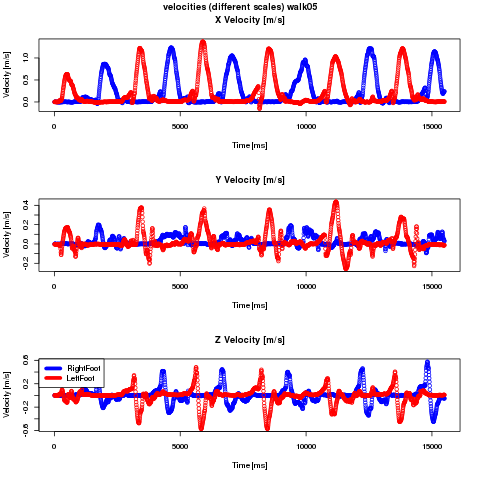
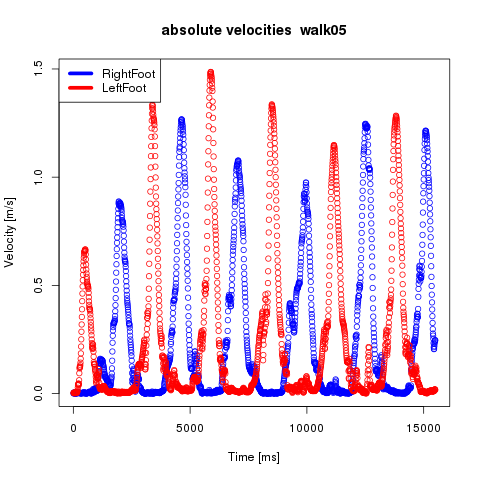
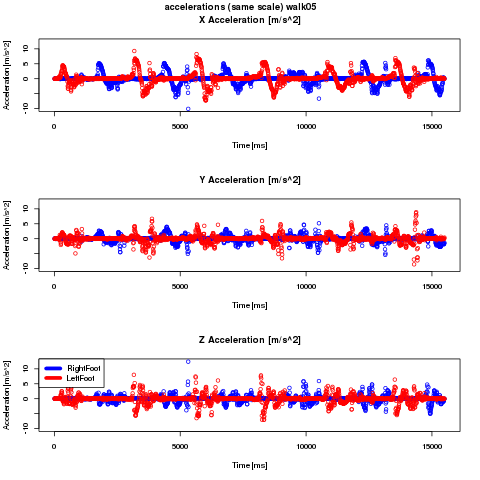
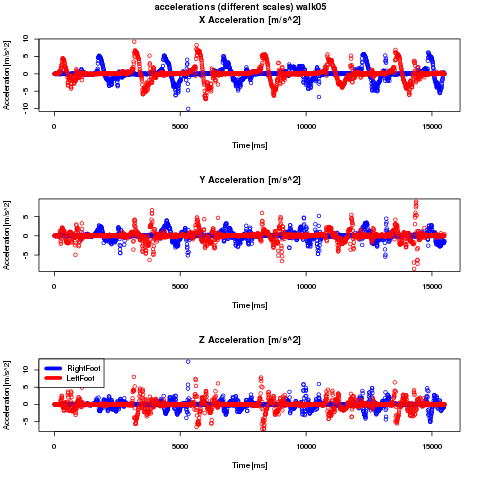
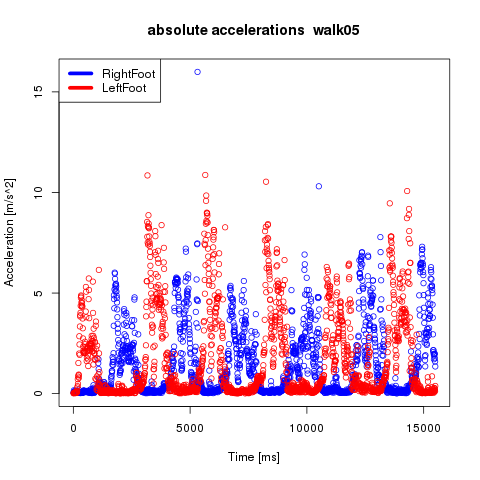
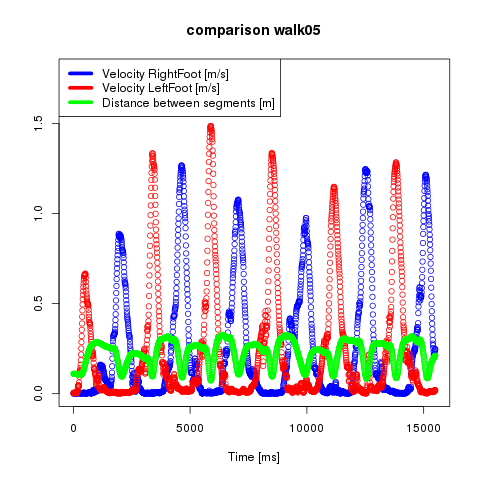
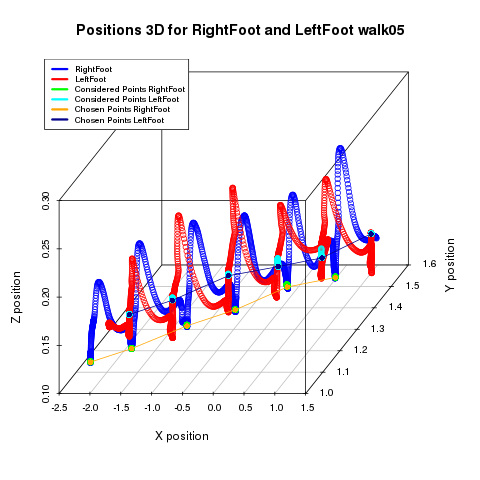
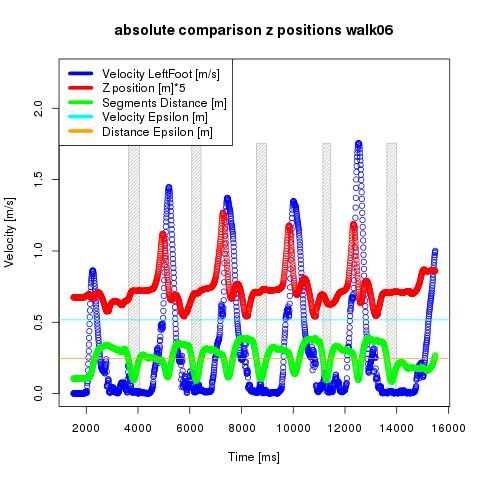
Positions of RightFoot and LeftFoot in x, y and z direction. Note that the scales are the same. Positions of RightFoot and LeftFoot in x, y and z direction. Note that the scales are different. Positions of RightFoot and LeftFoot in comparison with all other positions. Euclidian distance between the segments RightFoot and LeftFoot. Velocities of RightFoot and LeftFoot in x, y and z direction. Note that the scales are the same. Velocities of RightFoot and LeftFoot in x, y and z direction. Note that the scales are different. Absolute velocity values of the segments RightFoot and LeftFoot. Accelerations of RightFoot and LeftFoot in x, y and z direction. Note that the scales are the same. Accelerations of RightFoot and LeftFoot in x, y and z direction. Note that the scales are different. Absolute acceleration values of the segments RightFoot and LeftFoot. Comparison between the absolute velocity values and the euclidian distances of the segments RightFoot and LeftFoot.
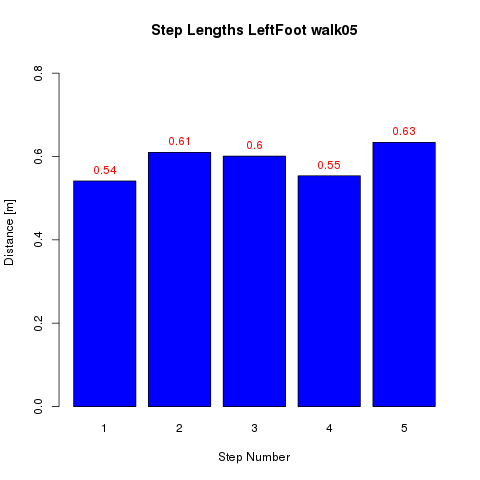
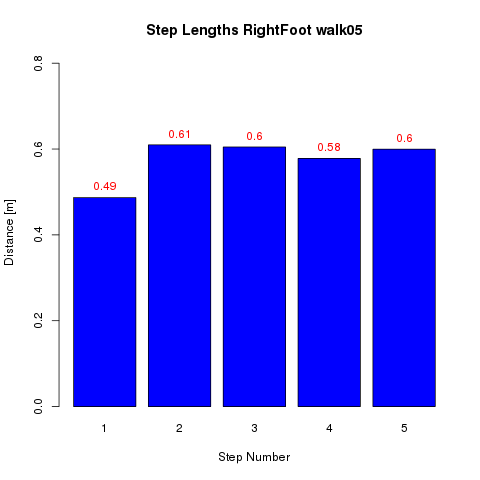
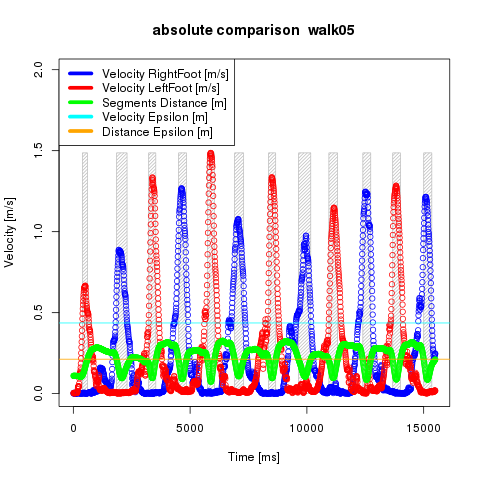
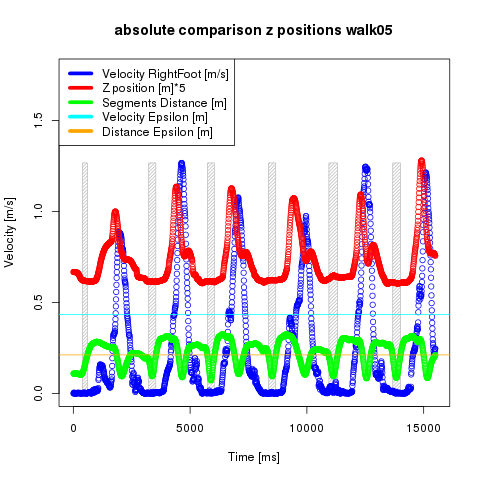
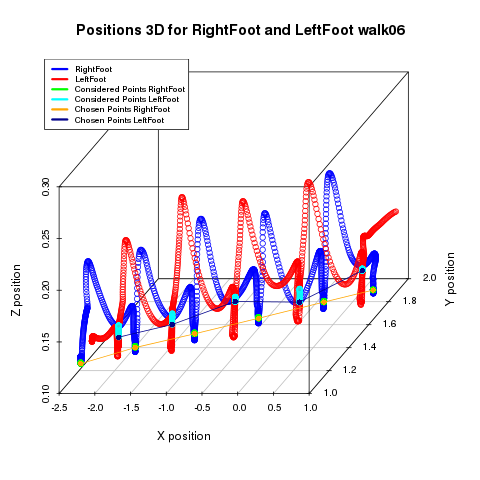
The calculated step lengths of LeftFoot. The calculated step lengths of RightFoot. Comparison of absolute velocity and distance between RightFoot and LeftFoot. Comparison of absolute velocity and Z position between RightFoot. Comparison of absolute velocity and Z position between LeftFoot. 3D positions of RightFoot and LeftFoot together with calculated points of steps. Calculated step lengths for LeftFoot and RightFoot.
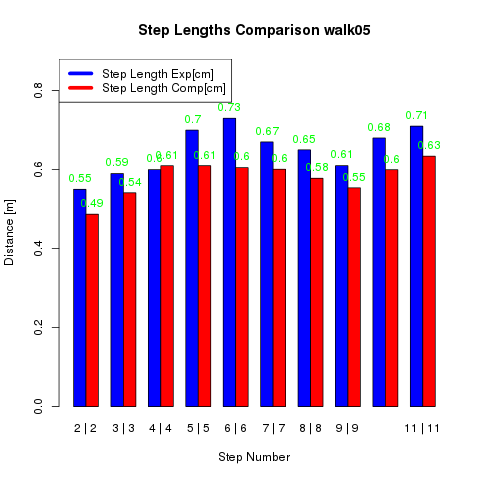
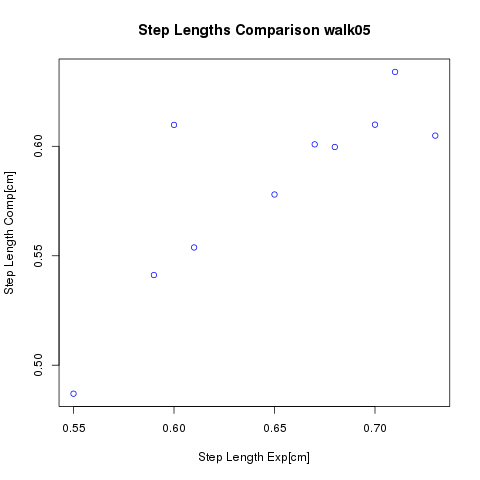
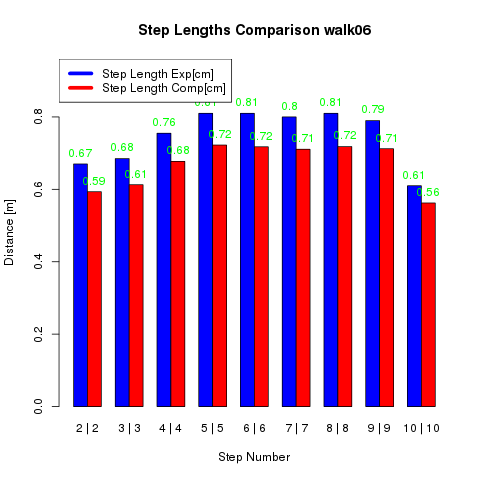
Comparison of measured and computed step lengths as csv table. Comparison of measured and computed step lengths as barplot. Comparison of measured and computed step lengths as scatterplot.
The step length in this walk was read from image files taken by a second person.
Visualised Movement Data
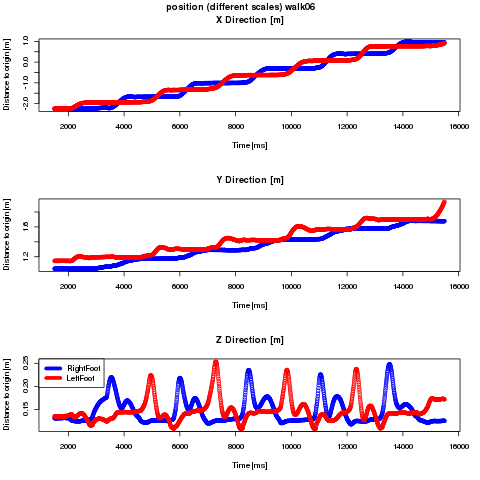
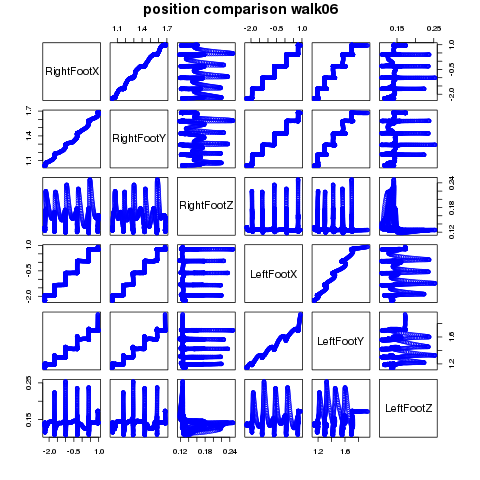
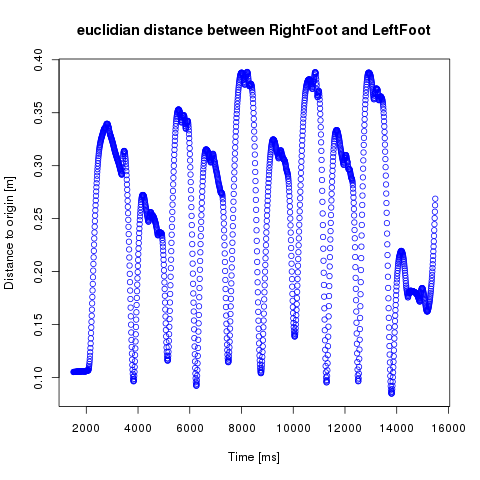
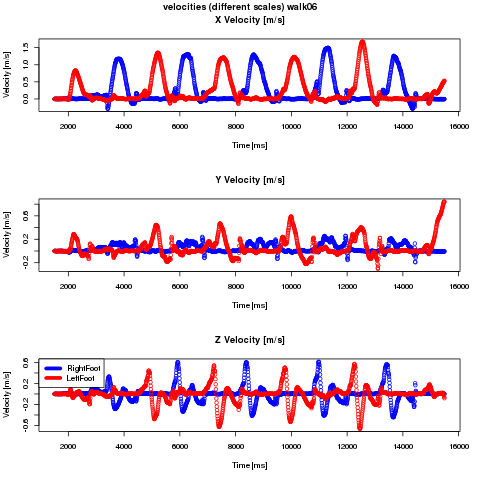
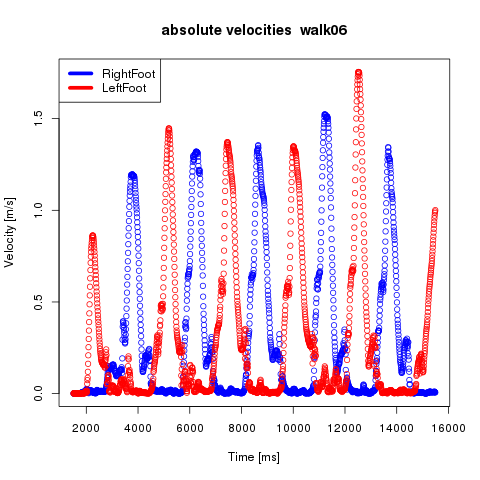
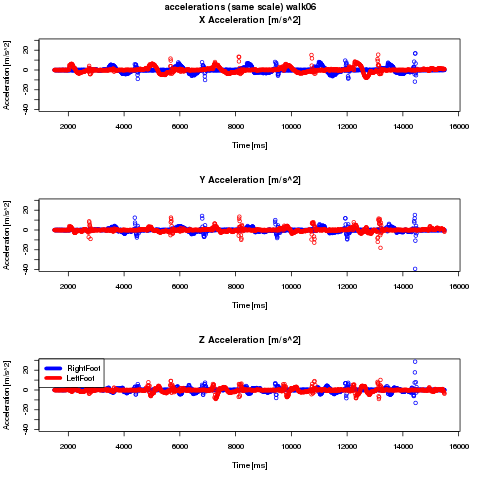
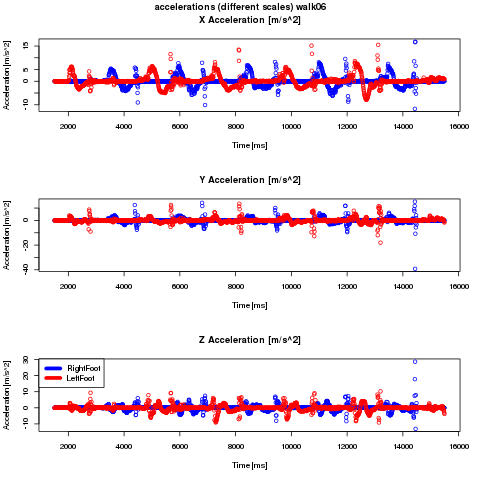
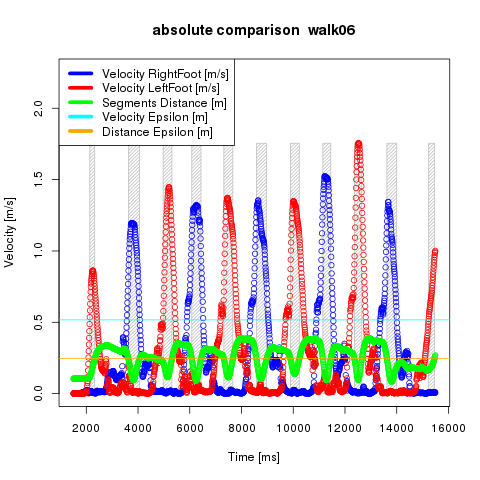
Positions of RightFoot and LeftFoot in x, y and z direction. Note that the scales are the same. Positions of RightFoot and LeftFoot in x, y and z direction. Note that the scales are different. Positions of RightFoot and LeftFoot in comparison with all other positions. Euclidian distance between the segments RightFoot and LeftFoot. Velocities of RightFoot and LeftFoot in x, y and z direction. Note that the scales are the same. Velocities of RightFoot and LeftFoot in x, y and z direction. Note that the scales are different. Absolute velocity values of the segments RightFoot and LeftFoot. Accelerations of RightFoot and LeftFoot in x, y and z direction. Note that the scales are the same. Accelerations of RightFoot and LeftFoot in x, y and z direction. Note that the scales are different. Absolute acceleration values of the segments RightFoot and LeftFoot. Comparison between the absolute velocity values and the euclidian distances of the segments RightFoot and LeftFoot.
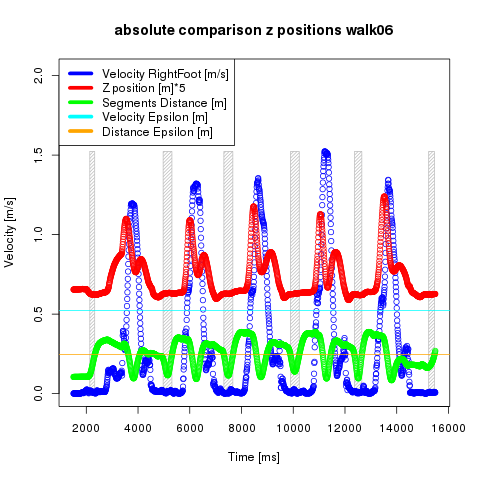
The calculated step lengths of LeftFoot. The calculated step lengths of RightFoot. Comparison of absolute velocity and distance between RightFoot and LeftFoot. Comparison of absolute velocity and Z position between RightFoot. Comparison of absolute velocity and Z position between LeftFoot. 3D positions of RightFoot and LeftFoot together with calculated points of steps. Calculated step lengths for LeftFoot and RightFoot.
Comparison of measured and computed step lengths as csv table. Comparison of measured and computed step lengths as barplot. Comparison of measured and computed step lengths as scatterplot.
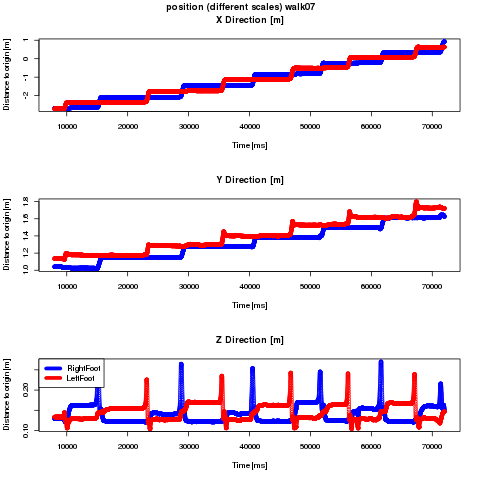
The step length in this walk was read from image files taken by the person wearing the Xsens MVN system
as shown in the video below.
Video of Walk07 showing a person taking photos while walking.
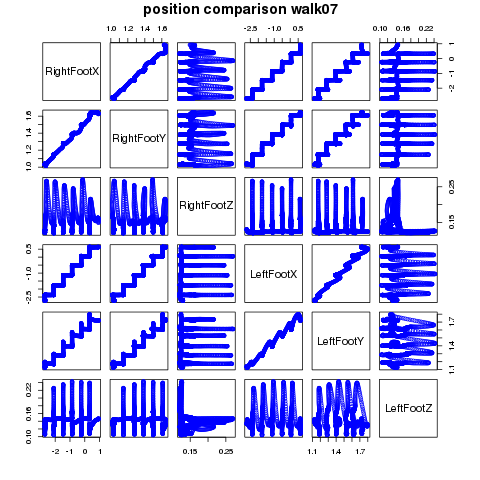
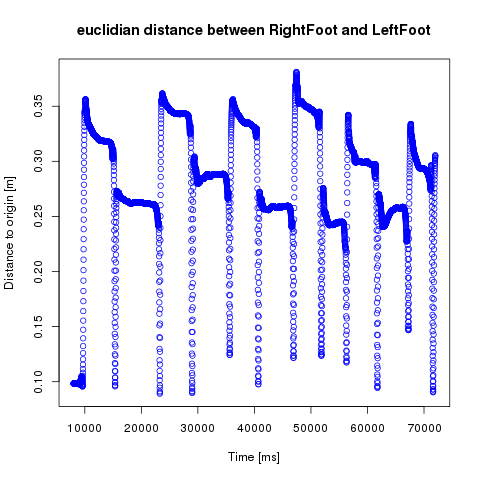
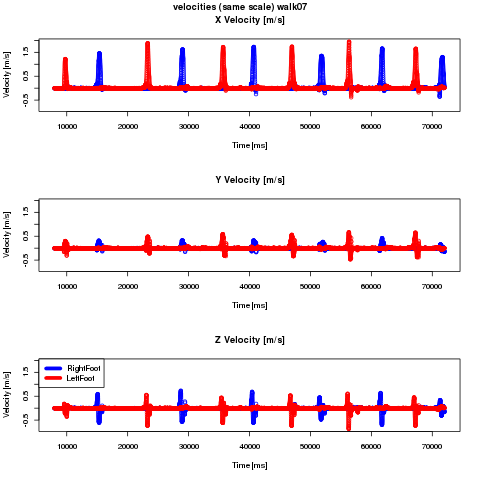
Visualised Movement Data
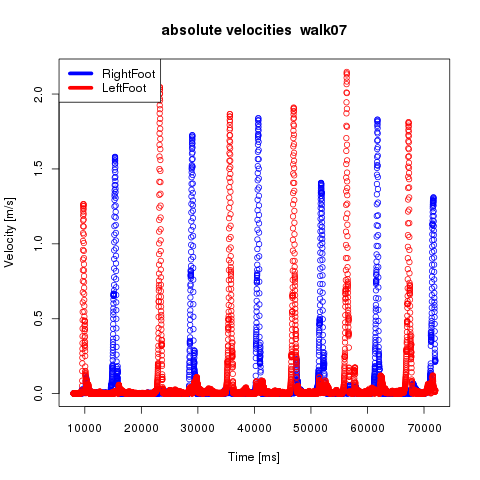
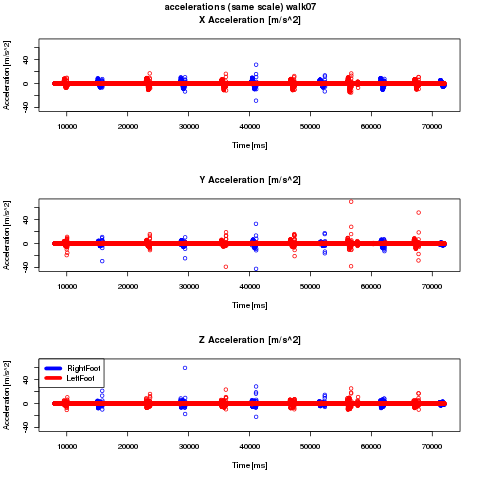
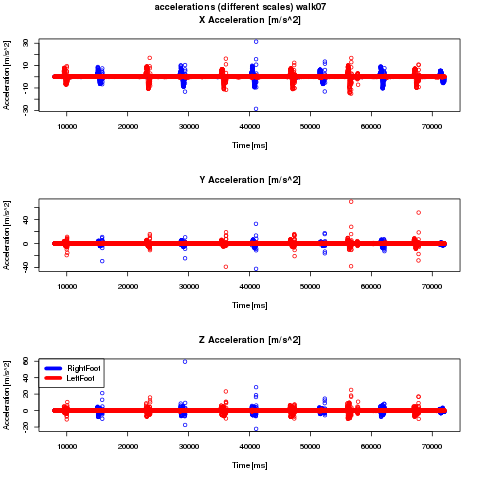
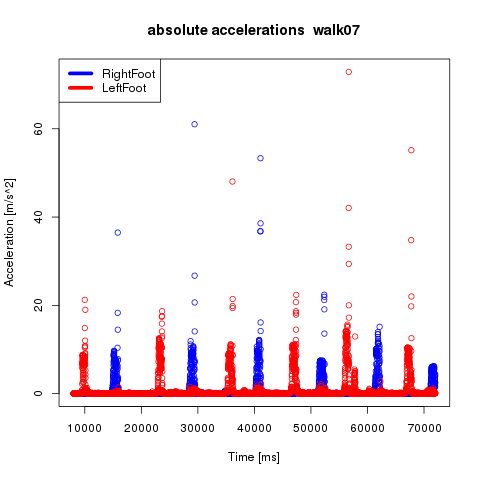
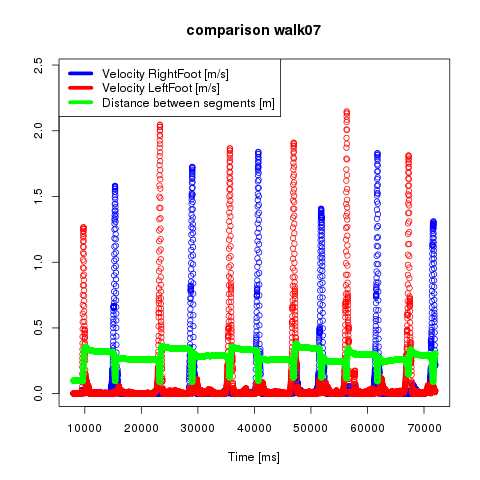
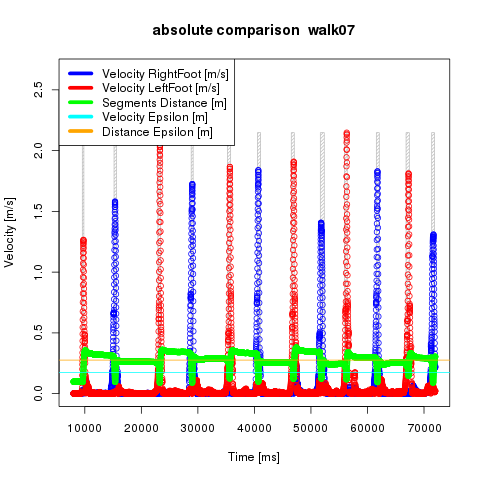
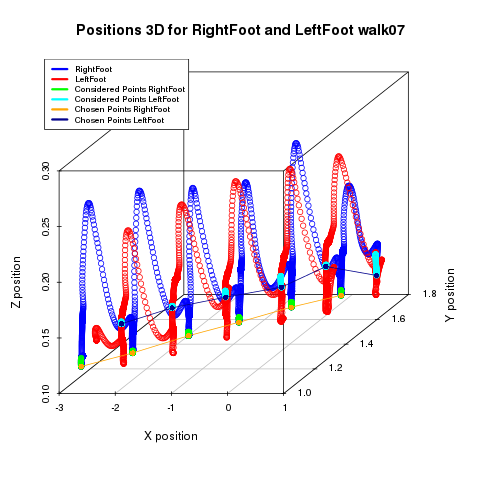
Positions of RightFoot and LeftFoot in x, y and z direction. Note that the scales are the same. Positions of RightFoot and LeftFoot in x, y and z direction. Note that the scales are different. Positions of RightFoot and LeftFoot in comparison with all other positions. Euclidian distance between the segments RightFoot and LeftFoot. Velocities of RightFoot and LeftFoot in x, y and z direction. Note that the scales are the same. Velocities of RightFoot and LeftFoot in x, y and z direction. Note that the scales are different. Absolute velocity values of the segments RightFoot and LeftFoot. Accelerations of RightFoot and LeftFoot in x, y and z direction. Note that the scales are the same. Accelerations of RightFoot and LeftFoot in x, y and z direction. Note that the scales are different. Absolute acceleration values of the segments RightFoot and LeftFoot. Comparison between the absolute velocity values and the euclidian distances of the segments RightFoot and LeftFoot.
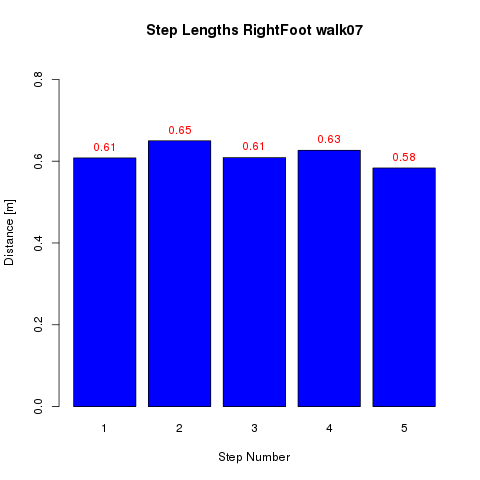
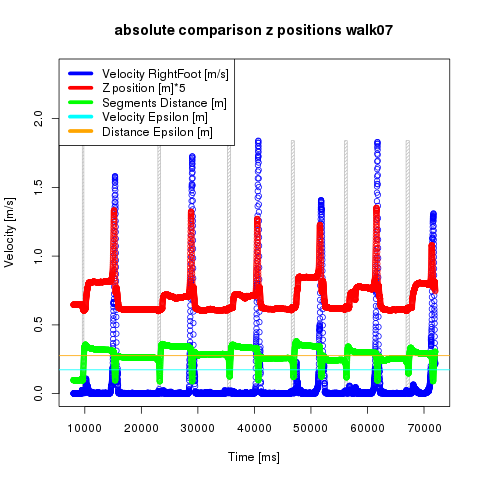
The calculated step lengths of LeftFoot. The calculated step lengths of RightFoot. Comparison of absolute velocity and distance between RightFoot and LeftFoot. Comparison of absolute velocity and Z position between RightFoot. Comparison of absolute velocity and Z position between LeftFoot. 3D positions of RightFoot and LeftFoot together with calculated points of steps. Calculated step lengths for LeftFoot and RightFoot.
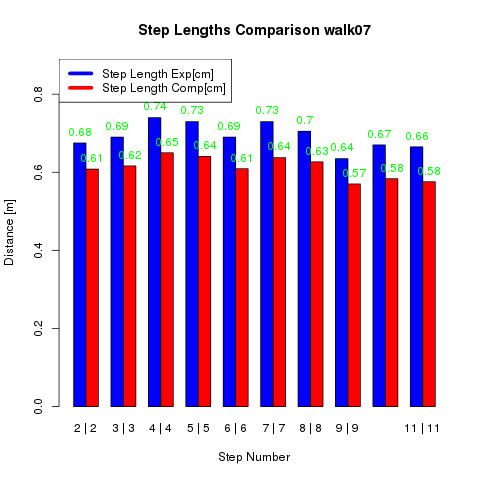
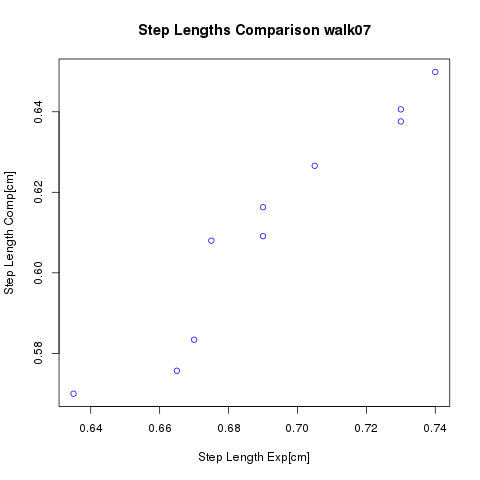
Comparison of measured and computed step lengths as csv table. Comparison of measured and computed step lengths as barplot. Comparison of measured and computed step lengths as scatterplot.
Video of Walk10 showing a person walking without further disturbance.
Visualised Movement Data
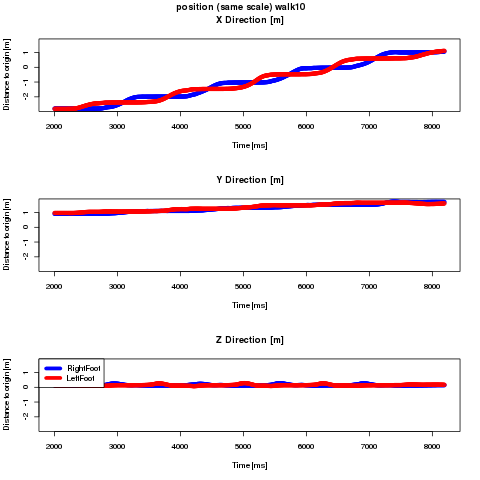
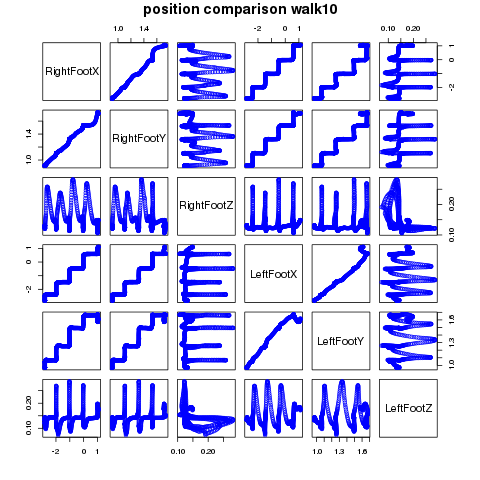
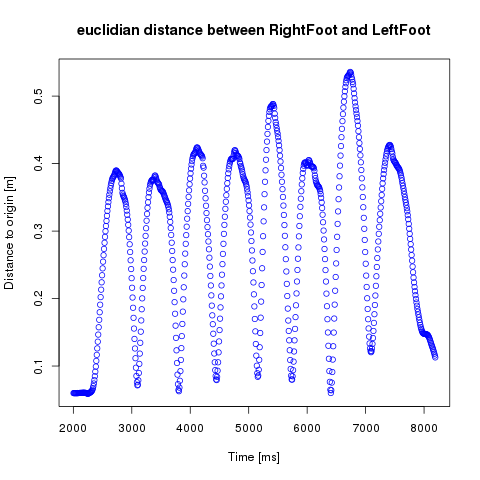
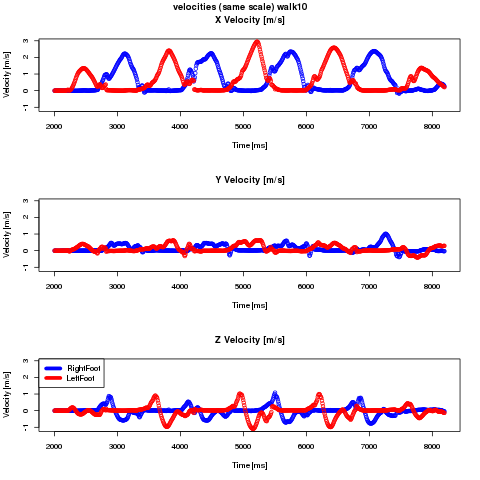
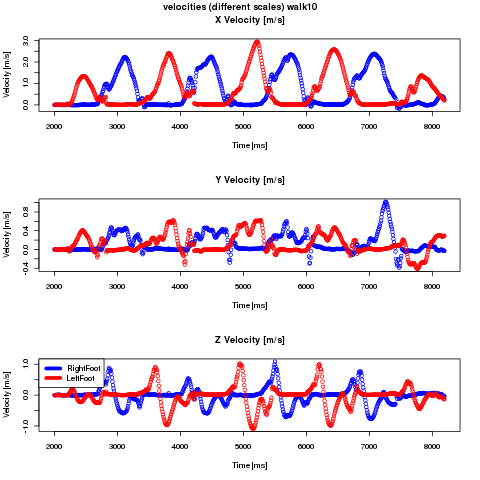
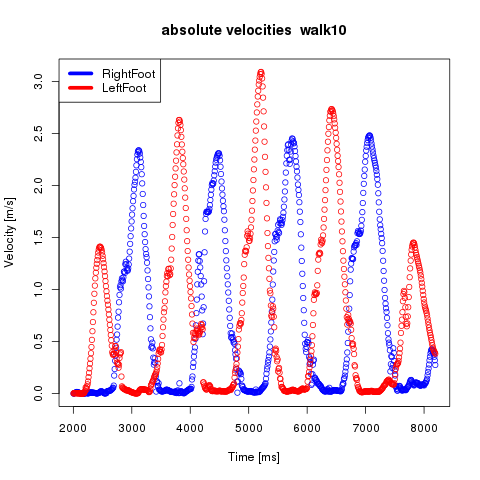
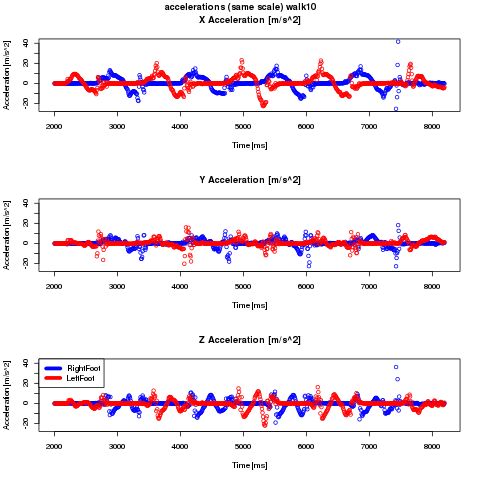
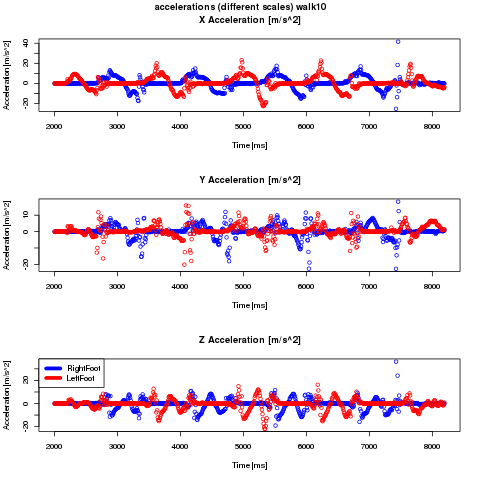
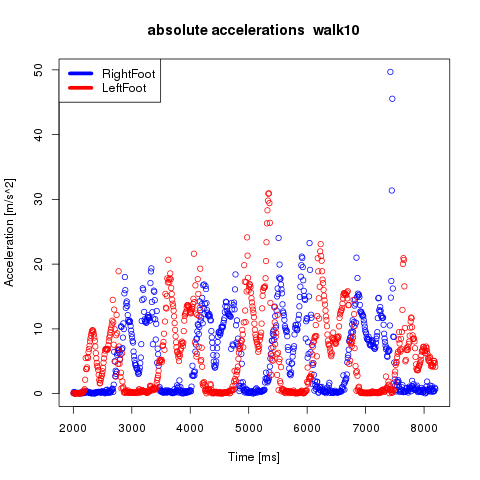
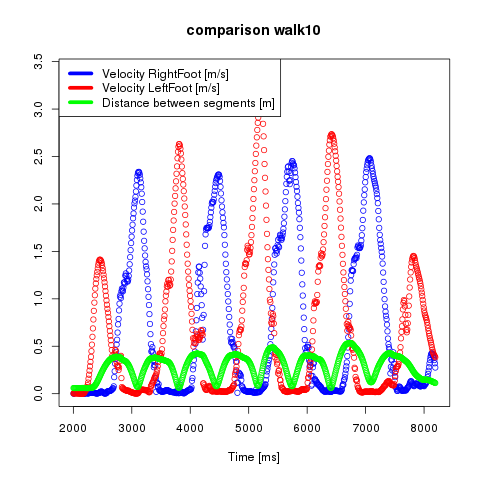
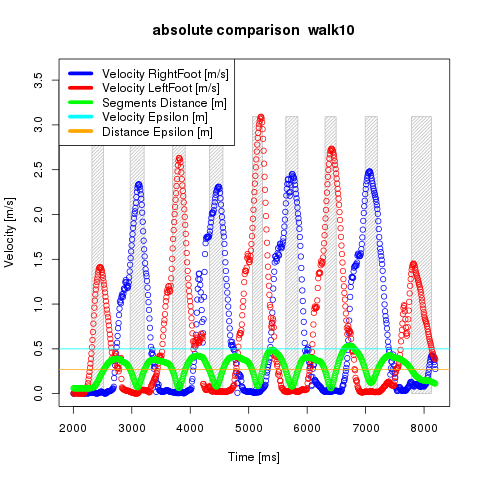
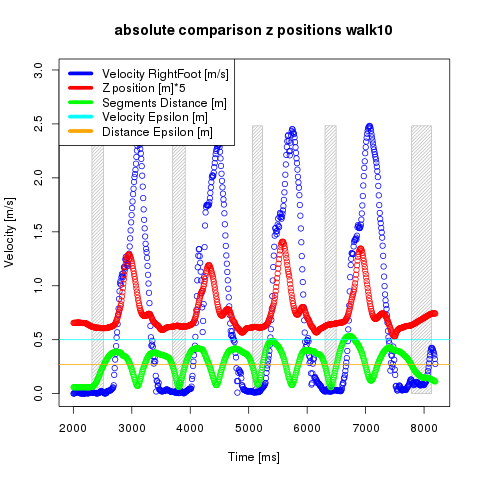
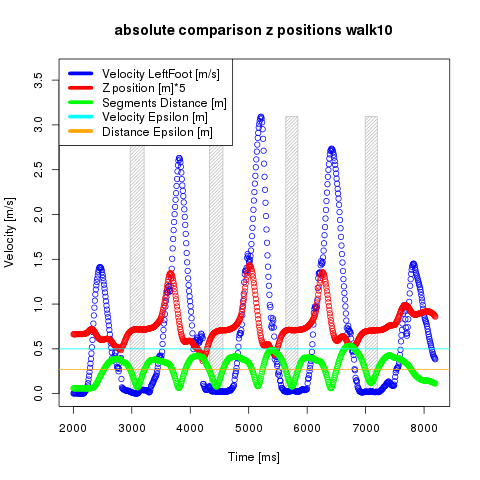
Positions of RightFoot and LeftFoot in x, y and z direction. Note that the scales are the same. Positions of RightFoot and LeftFoot in x, y and z direction. Note that the scales are different. Positions of RightFoot and LeftFoot in comparison with all other positions. Euclidian distance between the segments RightFoot and LeftFoot. Velocities of RightFoot and LeftFoot in x, y and z direction. Note that the scales are the same. Velocities of RightFoot and LeftFoot in x, y and z direction. Note that the scales are different. Absolute velocity values of the segments RightFoot and LeftFoot. Accelerations of RightFoot and LeftFoot in x, y and z direction. Note that the scales are the same. Accelerations of RightFoot and LeftFoot in x, y and z direction. Note that the scales are different. Absolute acceleration values of the segments RightFoot and LeftFoot. Comparison between the absolute velocity values and the euclidian distances of the segments RightFoot and LeftFoot.
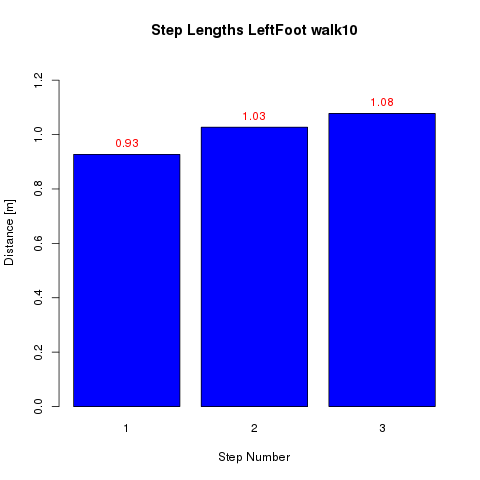
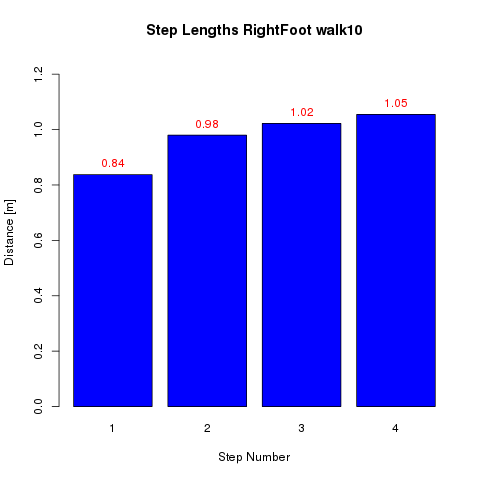
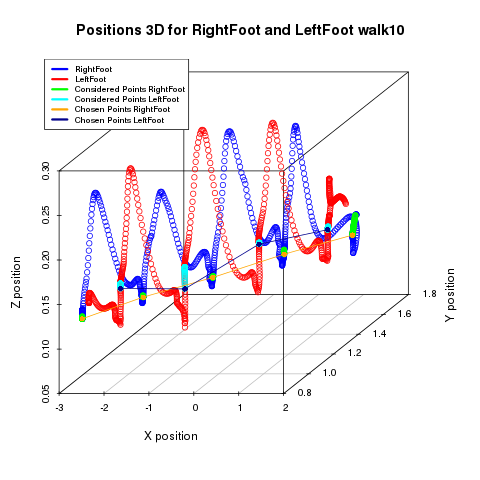
The calculated step lengths of LeftFoot. The calculated step lengths of RightFoot. Comparison of absolute velocity and distance between RightFoot and LeftFoot. Comparison of absolute velocity and Z position between RightFoot. Comparison of absolute velocity and Z position between LeftFoot. 3D positions of RightFoot and LeftFoot together with calculated points of steps. Calculated step lengths for LeftFoot and RightFoot.
Due to poor light conditions the video and image data was hard to read. Additionally the time used by
the Xsens MVN system showed some differences from the time of the running OS that was used to synchronize with
the video cameras. Therefore the annotation of the mvnx data files was not quite as simple and accurate was
we would have expected.
As already described on the page about the definition of step lengths
the computation of the step lengths depends on its definition. In this approach a combination of the velocity
of both feet (one moving, one standing) and the distance between them was used to extract the timeframes of the steps.
As shown in the 3D plots this works quite well.
However, the computed step lengths are on average about 7cm smaller than the measured ones. This could have several reasons, as listed below.
Possible sources of error
Time of electronic recording systems is not fully synchronised. (cm)
Different frame rates (50 fps for digital video camera, 120 fps for Xsens MVN system). (cm)
Folding rules are not straight aligned. (cm)
Distance is not read precisely in video/image analysis. (cm)
Distorting from video camera lens. (cm)
Electrical disturbances from WiFi, Handy, … for 3D motion data.
Gear is unnatural because of experiment design.
Gear is unnatural because of wearing the tight Xsens MVN system.
Gear is unnnatural because of stopping for taking photos.
Position shift during recording with the Xsens MVN system as described
in the MVN User Manual on page 41 (MV0391P, Revision B, from May 26th 2010). (cm)
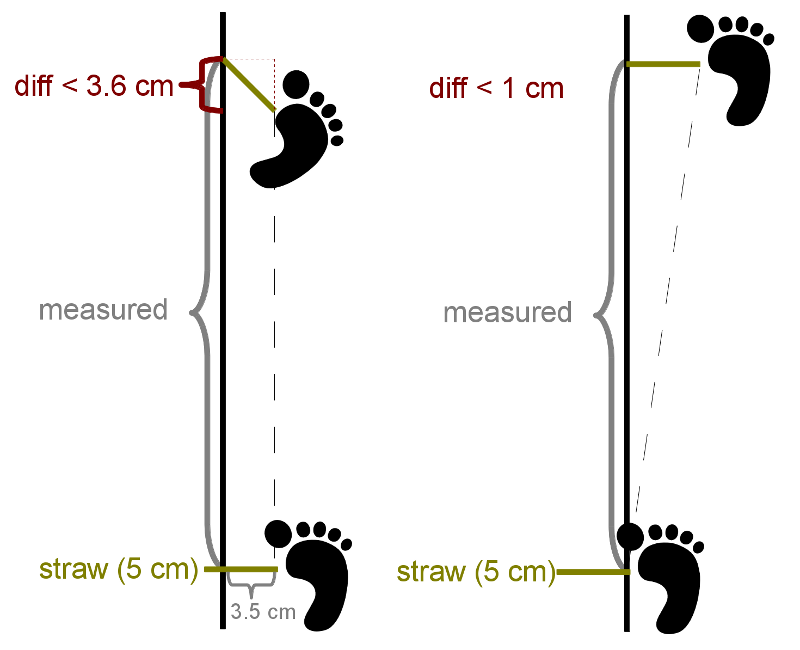
Step size is only measured in walking direction, ignoring deviations to the left and right (see figure below).
Wrong interpretation of Contact Points in Xsens MVN system
as described in the MVN User Manual on page 51 (MV0391P, Revision B, from May 26th 2010). (cm)
Errors while calibrating Xsens MVN system.
Possible deviation from measured values based on experiment design.
Error Resolution
As shown in the scatterplots of the comparison of measured and computed step lengths
the error is rather proportional to the size of the step length. This suggests that there was
an undetected failure while calibrating the system. As described in the MVN User Manual on page 97 (MV0391P, Revision B, from May 26th 2010)
the position data is calculated based on the acceleration and a human body model created while calibrating.
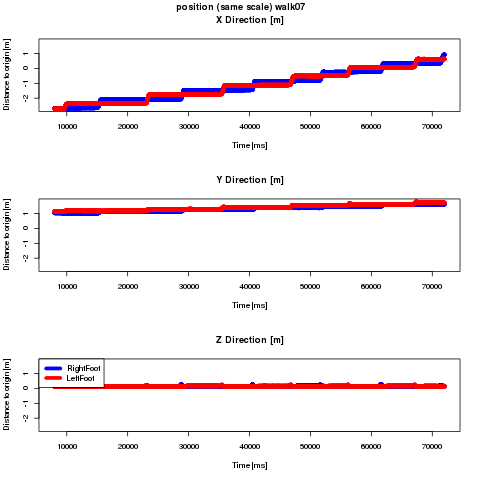
To encourage this point the length of the whole walk was analysed based on timestamps. To put it another way the length
between the starting point and the end point of the walks was computed based on timestamps extracted from the video and image analyses.
As shown in the table below the distances in the virtual world are shorter than in reality.
Computed Length [m]
Adjustment [m]
Difference to 4m [m]
walk05
3.2
0.46
0.34
walk06
3.24
0.37
0.39
walk07
3.39
0.18
0.43
This table shows the computed virtual world distance from the starting point to the endpoint of each walk.
An adjustment value is given in real world distance to align to the 4m measuring leash. In the last column
the difference to the real world data is given: 4m - adjustment - virualWorldDistance is given.
Accordingly the computed step lengths have been extended: the median of all the ratios of the computed and the measured step
lengths has been used, as shown in the table below. This was calculated separately for each side.
Step Number Exp
Step Length Exp[cm]
Step Length Comp[cm]
Side
Accuracy on Photo
Ratio Comp/Exp
Adjusted Comp[cm]
Diff Exp – Adjusted[cm]
walk05
2
55
48.7
right
bad
0.89
54.98
0.02
walk05
5
70
60.99
left
good
0.87
68.3
1.7
walk05
6
73
60.49
right
good
0.83
68.29
4.71
walk05
7
67
60.09
left
good
0.9
67.29
-0.29
walk05
8
65
57.8
right
bad
0.89
65.25
-0.25
walk05
9
61
55.38
left
average
0.91
62.02
-1.02
walk05
10
68
59.97
right
average
0.88
67.7
0.3
walk05
11
71
63.4
left
average
0.89
71
0
walk06
2
67
59.35
right
good
0.89
67
0
walk06
3
68.5
61.28
left
bad
0.89
68.63
-0.13
walk06
4
75.5
67.73
right
average
0.9
76.46
-0.96
walk06
5
81
72.24
left
average
0.89
80.9
0.1
walk06
6
81
71.75
right
good
0.89
81
0
walk06
7
80
71.07
left
bad
0.89
79.59
0.41
walk06
8
81
71.83
right
bad
0.89
81.09
-0.09
walk06
9
79
71.22
left
average
0.9
79.76
-0.76
walk06
10
61
56.23
right
average
0.92
63.48
-2.48
walk07
2
67.5
60.8
right
good
0.9
68.64
-1.14
walk07
3
69
61.63
left
good
0.89
69.02
-0.02
walk07
4
74
64.99
right
good
0.88
73.37
0.63
walk07
5
73
64.06
left
good
0.88
71.74
1.26
walk07
6
69
60.91
right
good
0.88
68.76
0.24
walk07
7
73
63.76
left
good
0.87
71.4
1.6
walk07
8
70.5
62.66
right
good
0.89
70.74
-0.24
walk07
9
63.5
57
left
good
0.9
63.83
-0.33
walk07
10
67
58.34
right
good
0.87
65.86
1.14
walk07
11
66.5
57.57
left
good
0.87
64.47
2.03
Median
0.89
0
Mean
0.89
0.24
Variance
0
1.7
Standard Deviation
0.02
1.3
This table shows the adjusted computed step lengths together with the data presented in the results part.
Therefore the step lengths have been divided by the foot specific median of the ratio Step Length Comp[cm]/ Step Length Exp[cm].
As shown in the last column the difference between the computed and measured step length is (with exceptions) in the
expected magnitude (smaller 3cm).
The difference between the computed and measured step lengths now is as expected small.
Only one value is bigger than 3cm, but this probably is based on a wrong extrapolation
in the video analysis from the step before that was removed from this table (the camera missed
the relevant step when it hit the ground, so the position was extrapolated).
Conclusion
Based on the experience of this first experiment it would be recommended to start a second one,
but with:
Better Light Conditions.
Confirmation of correct human body model after calibration.
Additional digital time measurement to generate time markers for observed events.